How to Make Infographics for Social Media

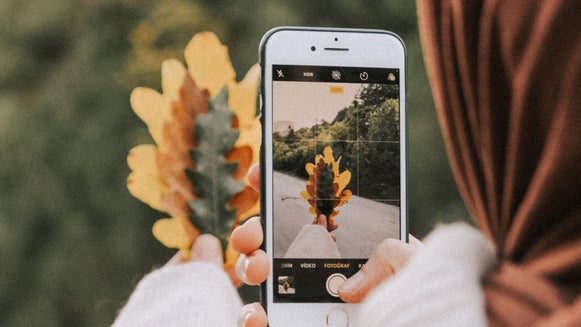
Content is all around us and with so many content creators relying on engaging material to fuel their following, it is important that you keep in mind your content’s shareability. Creating shareable content can be as easy as taking an epic, inspirational photo - but with so many images flooding feeds, it is getting more important to mix up the type of content that you are sharing on your profile. Say hello to infographics!
What Are Infographics?
Infographics are graphics that communicate dense material in a fun way. This can be done with complex ideas that you’re trying to simplify like showcasing statistics on a very complex issue, or it can be done with fun and engaging content like sharing your favorite travel spots from one of your recent travels. Rather than writing all of the information out in your comment section, the content is split up and shared visually.
Why Use Infographics for Carousels?
Graphics are a social media page’s secret weapon, especially if they are tucked away in a carousel. Considering that Instagram Carousels have the highest engagement rate of all post types, now is the time to create some inspirational design content that your followers can share with their friends or save to refer back to at a later time.
Carousel graphics should be inspirational, shareable, and visually appealing. Some of the best graphics here are typographic quotes or even sharing useful content, like sharing favorite spots you visited on a recent trip you took. If this was something that you were thinking of sharing, how would you go about creating a graphic to share your trip tips? Infographics are a great piece of sharable, visually appealing content. With BeFunky’s Graphic Designer, you can create one in no time.
How to Create a Shareable Infographic
If you want to try your hand at creating a travel infographic then look no further. To get started in BeFunky’s Designer, click here.
Step 1: Write Out Your Favorite Travel Spots and Tips
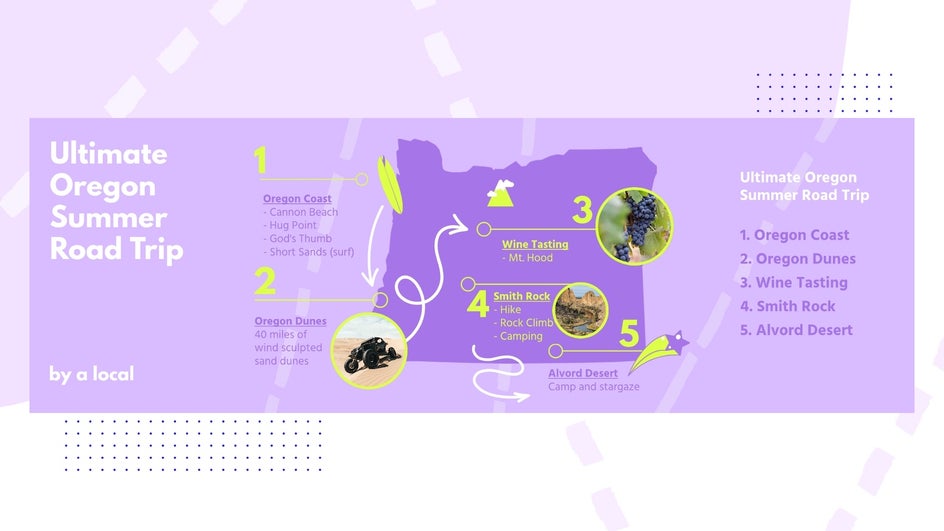
You can approach making a travel infographic in many ways. You could highlight your favorite spots along the way, share helpful tips that enhanced your trip, or share statistics about the places you visited.
Step 2: Setting Project Dimensions
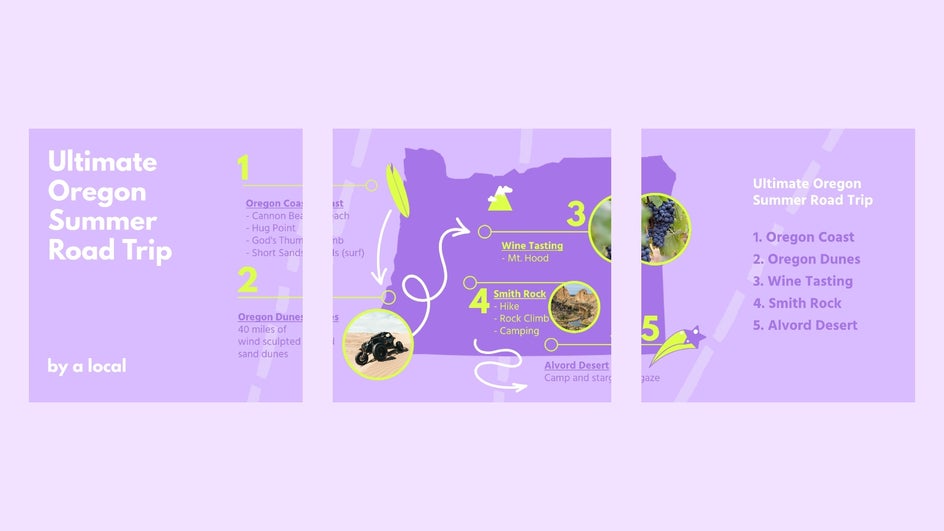
If you want to go with an Infographic template, check out our offerings here. But since we want people to save this post on Instagram, we are going to create a custom Instagram carousel infographic. We are going to highlight our favorite places along our route so that they can save and share either one or more posts with a 3-slide Instagram Carousel.
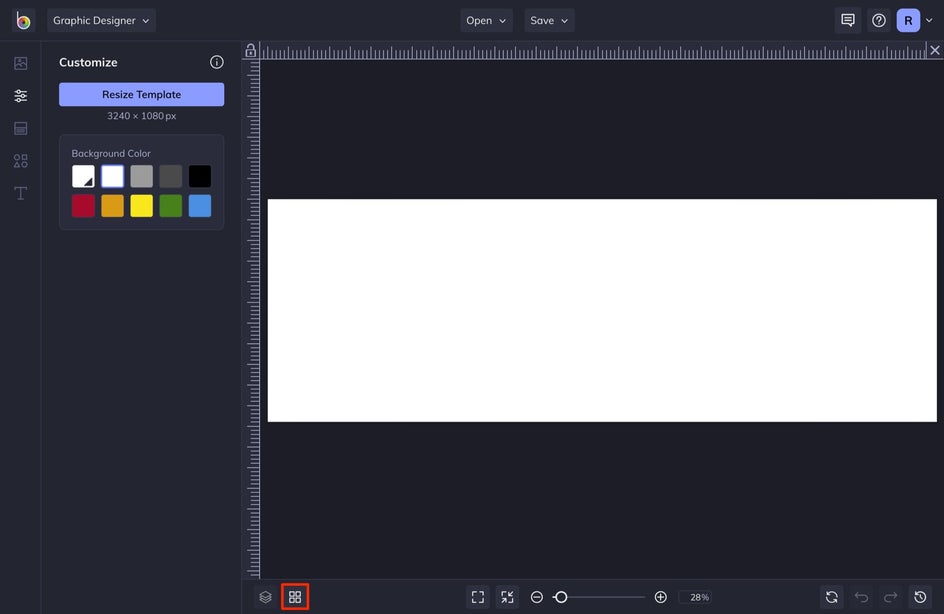
To do this, select the Blank Canvas tab. In the left-hand menu, set the height to 1080px. For the width, multiply the number of slides you want with 1080. For us, it would be 3x1080, which equals 3240. Our dimensions for this will be 1080x3240.

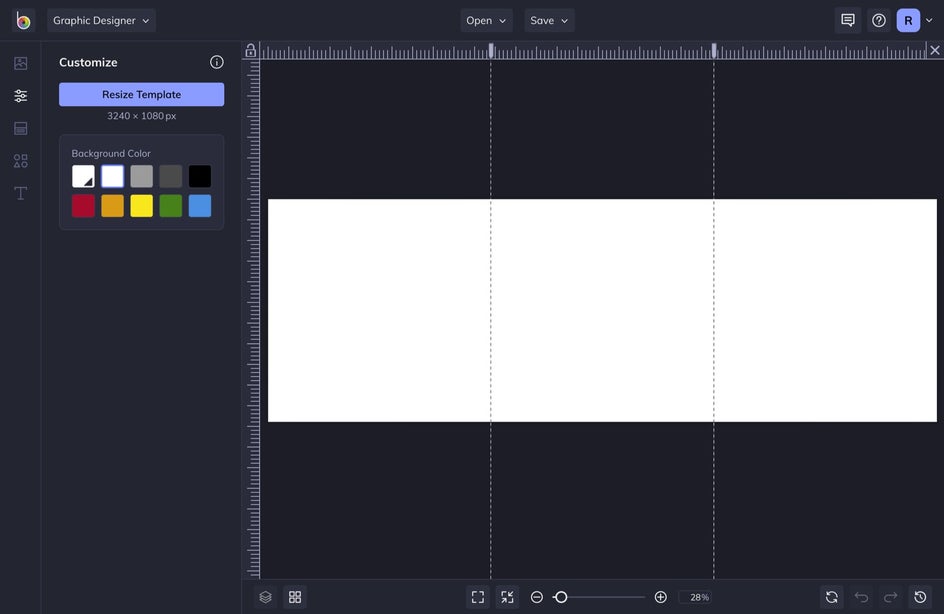
Once you have your artboard set, go to Settings and turn on your Guides by clicking the toggle button next to it.
To place guides on your artboard, simply click on the top ruler and drag your mouse to the left or right. You can see the first numbers change as you drag them left or right. You will want to place the first guide at 1080 and the second guide will be stationed at 2160 (3240-1080). This will help you see which section you are working on. We want to create one seamless design but also be able to split them up after we are finished.
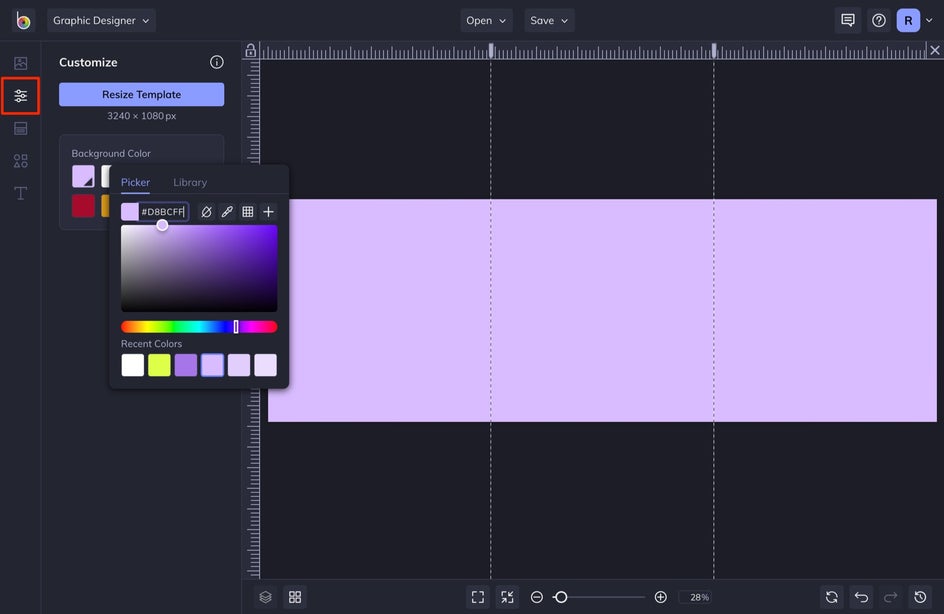
Step 3: Choose the Background Color
Choose a color palette that you want to start with. This can change as your design grows. We will be using purple. In the Customize tab, select the first square and choose a color from the menu that appears.
Step 4: Map Out Your Design
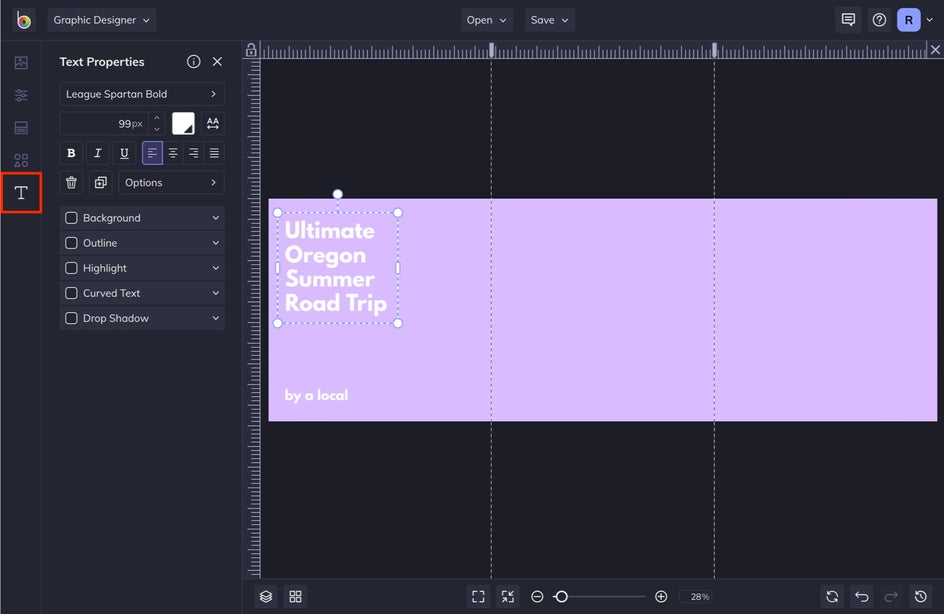
The first square will be composed primarily of text to give your audience clarity on what the next few slides are about. Your goal is to get them to swipe, so make your title catchy.
To add text, select Text from the left-hand menu. Type in your title and then with the text box selected, you can adjust the Font, Size, and more in the Text Properties menu that appears.
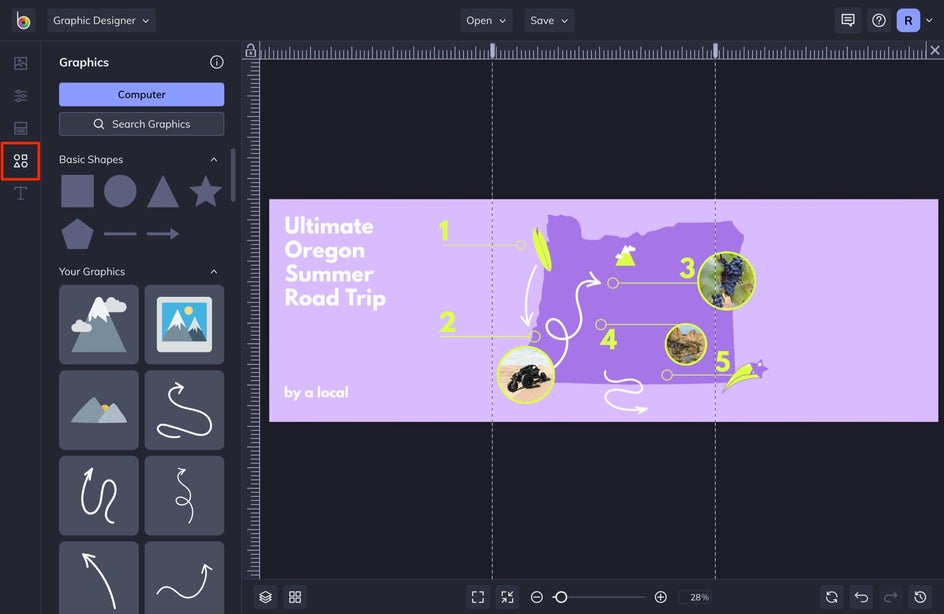
Next, we are going to add graphics. When we do this, we will include some that overlap on the first square from the second. This way, your audience knows that there is more information to see because the visual elements will draw their eye to want to see more.
To add these, select Graphics from the left-hand menu and then select Search Graphics to see hundreds of graphic elements from the Graphics Library. Simply select the images you want and they will be automatically added to Your Graphics.
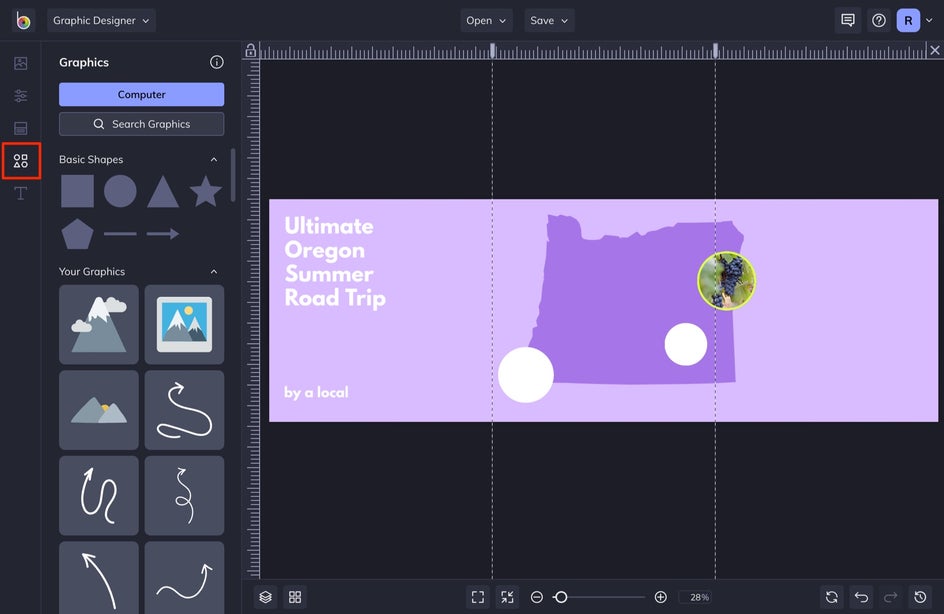
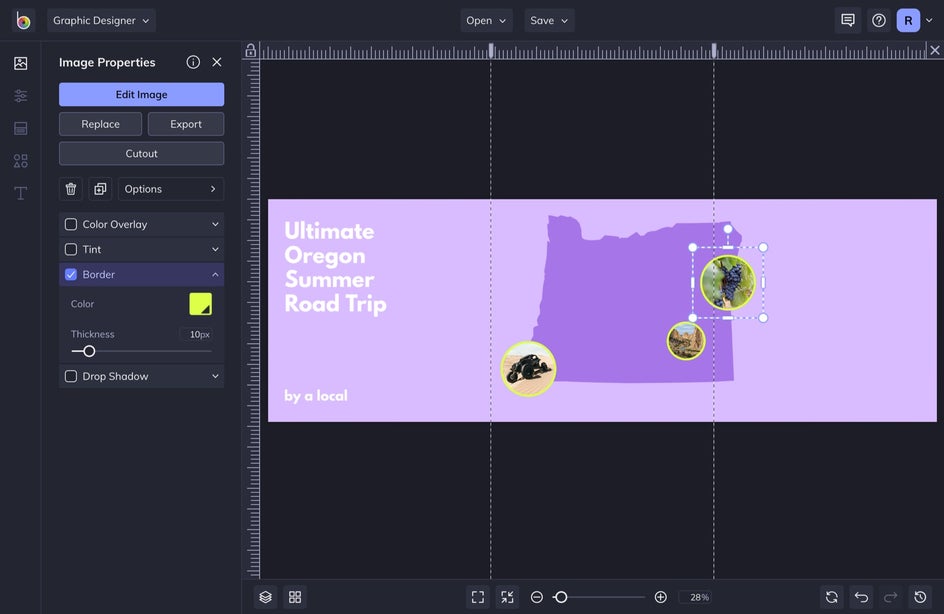
You can plug photos into graphic elements with the Masking feature. We are going to add circle graphics that we will add photos to first. If you want to follow our design and add photos to your graphic element, click the Image Manager left-hand tab. Here, you can upload your photos or choose from thousands of images by selecting Search Stock Images.
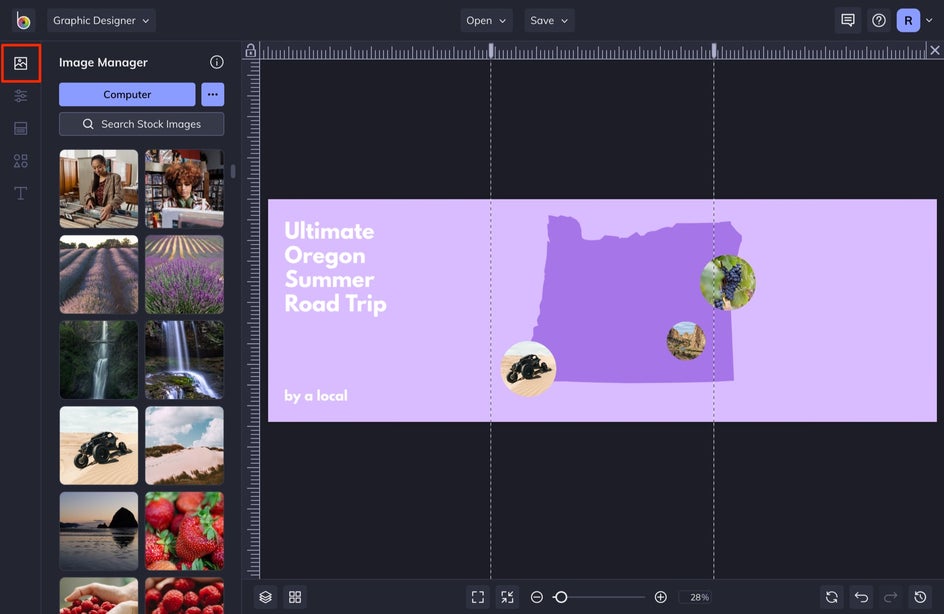
To add the photo to your circle element, simply drag your image over the element until you see it highlight blue and then release your mouse. The image will be automatically added. To adjust the crop and size, simply double-click into the element to manipulate the image. With your elements selected, you can change the Image Properties in the menu that appears. We will add an outline to make the images stand out.
Continue with designing until you have your desired visual elements added. Don’t be afraid to delete, move, and rearrange what you put on there. Design is about building a visual element with layers and interest.
Step 5: Add Supporting Text
Visual elements are amazing and grab the eye, but the copy is how people know more information. Add in extra text for each place you are showcasing.
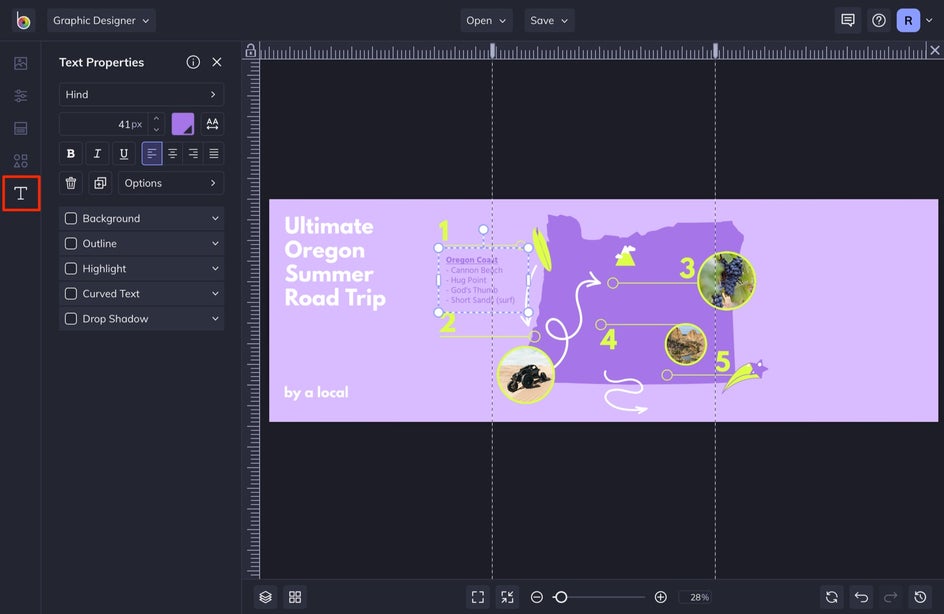
You can add in a name for the place as well as some other places nearby for them to check out, or you can share a short, fun detail about the place. Follow the steps above to adjust the font and its size. Make sure that the last 1080x1080 section lists all of them out in order so that people can easily save this to their profiles.
Step 6: Add Supporting Graphics
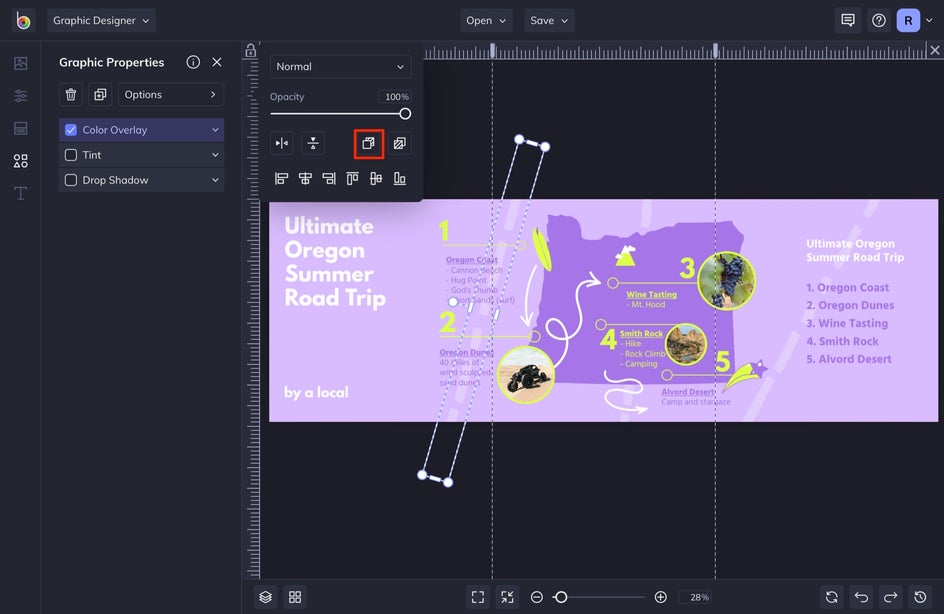
Add in some extra visual elements to the background. This creates depth within your piece. To do this, head back to the Graphics tab and add in more elements. Send the element to the background by selecting Options from the menu that appears and then select Move Backwards.
Step 7: Save the Project
Save your project by selecting Save at the top of your screen. You can choose to Save as Project, where you can save it to your Computer or BeFunky in order to come back to edit later - or you can save it as a JPEG to your computer by selecting Computer.
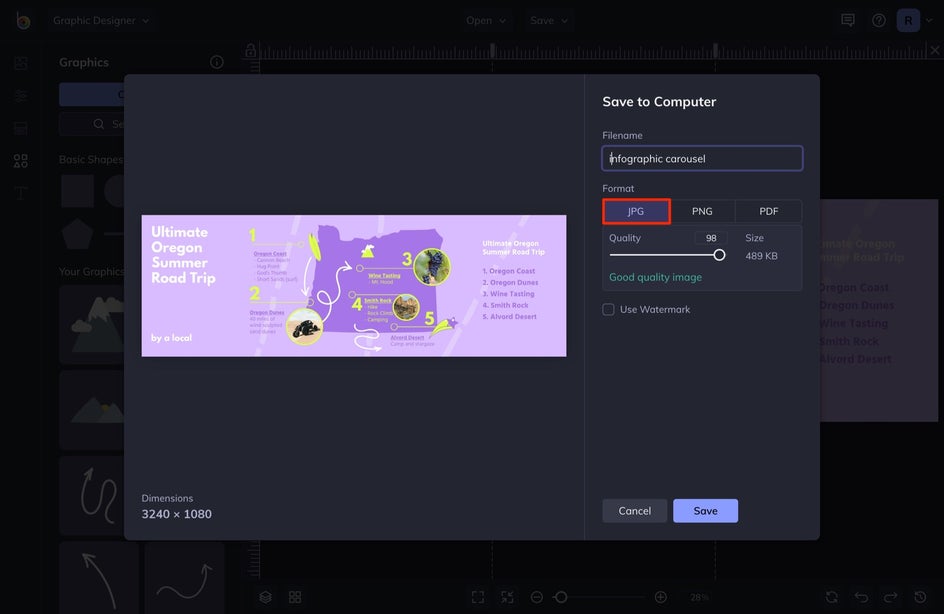
In order to post this on Instagram, you will need to save it as a JPEG. Select Computer and then make sure that the JPEG tab is selected.
Step 8: Split Up the Image
You will need to split up each of the 1080x1080 sections and upload them as a carousel to Instagram. To split up your JPEG, you can crop each of the sections in our Photo Editor, or you can easily find a conversion tool online that does this for you. There are multiple ways to do this, so choose whichever is easiest for you.
Elevate Your Feed With Infographics
If you want to create other dynamic pieces of content for your audience and you’ve got the photos and copywriting nailed down - try sharing engaging designs on your feed that people can save and refer back to as inspiration. This is one of the most popular features on Instagram and drives more traffic the more people share your content.
The next time you want to share a dense idea or plan in a visually compelling way, look no further than creating an infographic with BeFunky’s Designer or Infographic Maker. You will be sure to impress your followers and they surely won't be able to help saving and sharing your content.